When your offshore model crosses the Atlantic—twice—in one afternoon
We ran the same offshore wind farm steady-state model through two independent load-flow stacks:
- pandapower — open-source toolbox with strong roots in European university and TSO-style workflows
- OpenDSS — the EPRI-led engine that has shaped a huge share of U.S. distribution and integration studies
In Electrisim, we treat that pairing as a sanity check, not a beauty contest: if two solvers with different numerical cores and conventions still tell the same story on power balance and equipment stress, we gain confidence before shipping features to users.
What is in the model?
Single-line data exported from the diagram includes:
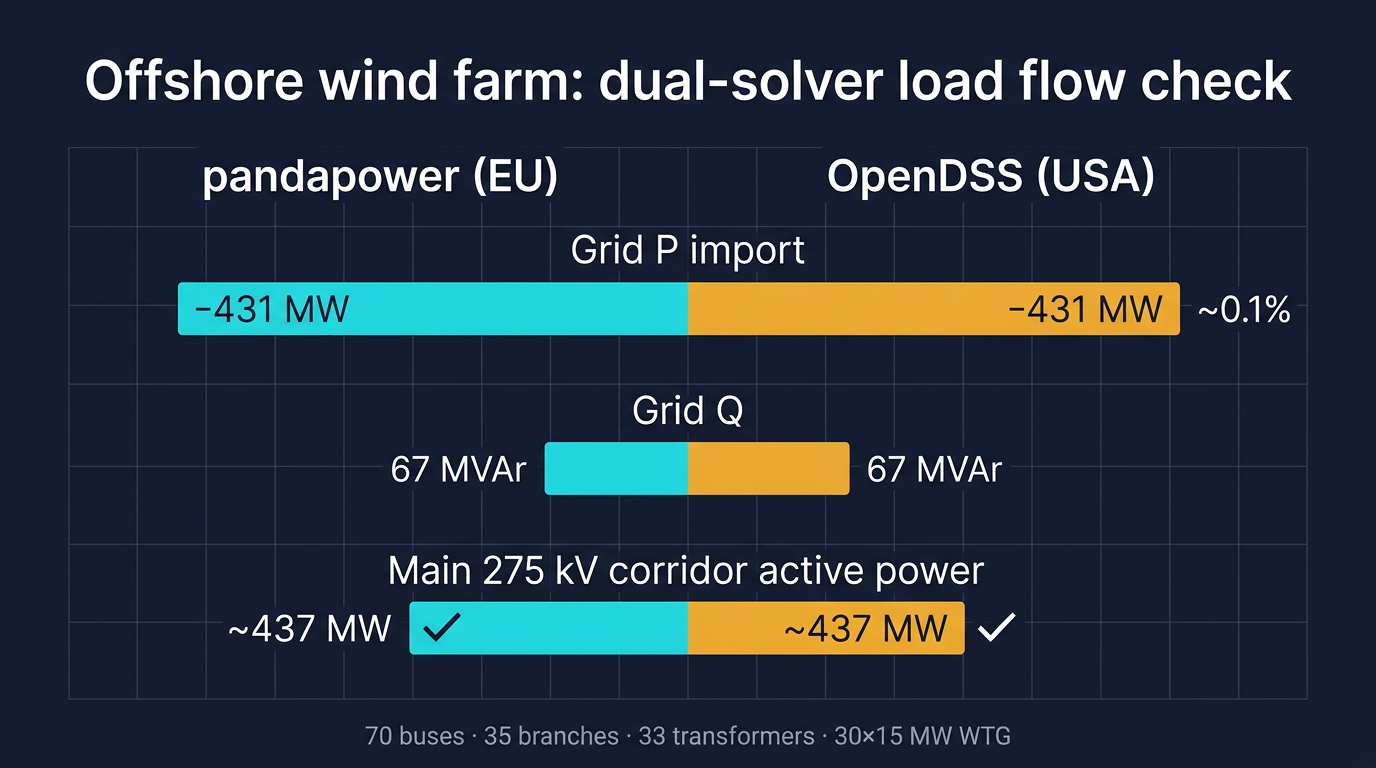
- 70 buses (400 / 275 / 66 / 15 / 0.69 / 0.4 kV)
- 35 branches (export cables, long offshore 275 kV link, 66 kV collector strings, parallel 400 kV circuits)
- 31 two-winding and 2 three-winding transformers (onshore/offshore hub and WTG step-up)
- 30 × 15 MW inverter-based units (450 MW in service), 1 small onshore auxiliary load, 2 shunt reactors, 1 grid equivalent — 50 Hz snapshot
For the downloadable template and changelog, see the offshore wind farm model page.
Do the results agree?
On the quantities operators care about first, yes — very closely:
- Slack active power ≈ −430.7 MW (pandapower) vs −431.2 MW (OpenDSS) — well under 0.2%
- Slack reactive ≈ 67.3 vs 67.1 MVAr
- Major 275 kV corridor active power (~437 MW) — ~0.1% difference
- Line currents often match to the third decimal (e.g. long offshore 275 kV segment ~0.914 kA in both exports)
Related: PandaPower vs OpenDSS — external grid modeling · Open-source tools vs PowerFactory
Run the same study in your browser with both engines — app.electrisim.com.