- Home
- Documentation
- Voltage stability
Voltage Stability Margin (P-V Curves)
pandapower
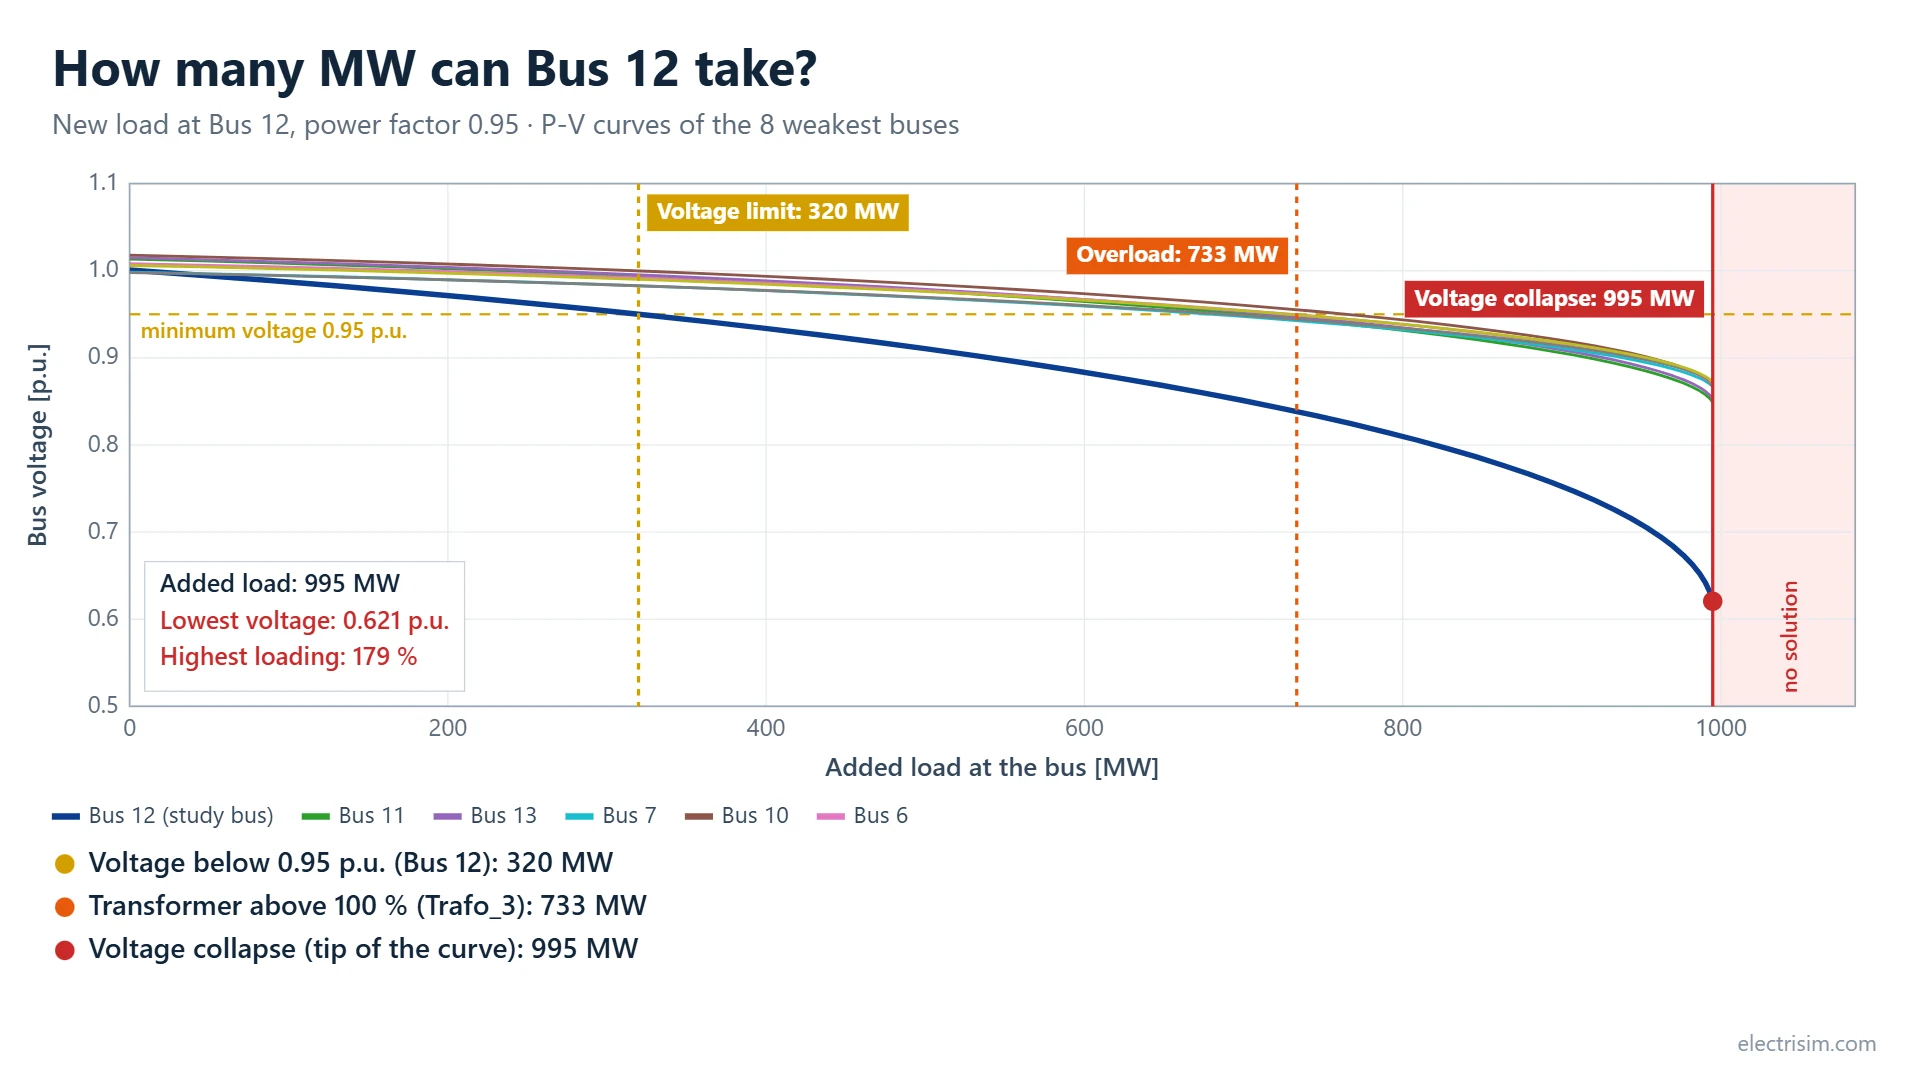
This study answers “how many MW can this bus, or this network, take?”. Electrisim raises the load step by step and runs an AC load flow at each step, until the load flow no longer solves. That last point is the tip of the P-V curve: beyond it there is no operating point, which is voltage collapse. On the way the study records where the first bus leaves the voltage limit and where the first line or transformer is overloaded, because one of those usually comes before the collapse and is the real limit of a connection.
Simulate → Voltage Stability Margin (P-V Curves). Requires a subscription. Confirm a base Load Flow converges first.
When to use
- Sizing a new load connection (data center, electrolyser, factory) at a candidate bus
- Finding which limit comes first: voltage, thermal loading or collapse
- Finding the weakest buses of a network as load grows
- Comparing candidate buses for a new connection
How to run
- Run a normal Load Flow first so you know the network solves as drawn.
- Optional: select the bus you are interested in on the diagram. The dialog then opens with that bus and the one-bus mode chosen.
- Click Simulate → Voltage Stability Margin (P-V Curves).
- Choose how the load grows, set the limits and the frequency, and click Calculate.
Dialog parameters
| Parameter | Description | Default |
|---|---|---|
| How the load grows | All loads grow together: every in-service load is scaled up by the same factor, P and Q together. A new load is added at one bus: a new load starts at 0 MW at the chosen bus and grows; the existing loads stay as they are. Compare buses: the one-bus study is repeated for every bus, or for the buses selected on the diagram (see Compare buses). | All loads (one bus when one bus is selected, compare when several are) |
| Bus for the new load | Used only in the one-bus mode. | The selected bus |
| Power factor of the new load | Inductive power factor of the added load, used in the one-bus and compare modes. A lower power factor lowers every limit. | 0.95 |
| Minimum voltage (p.u.) | The voltage limit that is reported on the way to the tip. | 0.95 |
| Maximum loading (%) | The loading of lines and transformers that counts as an overload. | 100 |
| Frequency | 50 or 60 Hz. | 50 Hz |
Results window
- Verdict — the first limit that is met and how many MW it leaves, then the collapse point and the lowest bus voltage there.
- Three tiles — the MW margin to the voltage limit, to the first overload and to voltage collapse. A limit that is already exceeded as drawn says so.
- P-V chart — bus voltage against load for the eight buses with the lowest voltage at the tip (the study bus is drawn thicker). Vertical lines mark the three limits; the shaded zone past the tip has no solution.
- Play — draws the curves as the load rises, with a readout of the load, the lowest voltage and the highest loading at the playhead.
- Save image (1080×1350 or 1920×1080) and Export video — the chart with a title and the limits written out, for a report or a post. The video is MP4 where the browser can record it, otherwise WebM.
- Tables — the limits in the order they are met, and the 20 weakest buses with their voltage now and at the tip. Download CSV gives every point of the curves.
Compare buses
Choose Compare all buses to see where the network has room for a new load. Electrisim adds the load at one bus, finds its limits, removes it, and moves on to the next bus. Select several buses on the diagram before opening the dialog to compare only those; the slack bus is always left out, because it has no collapse point. Each bus takes about a second, and up to 60 buses are compared in one run.
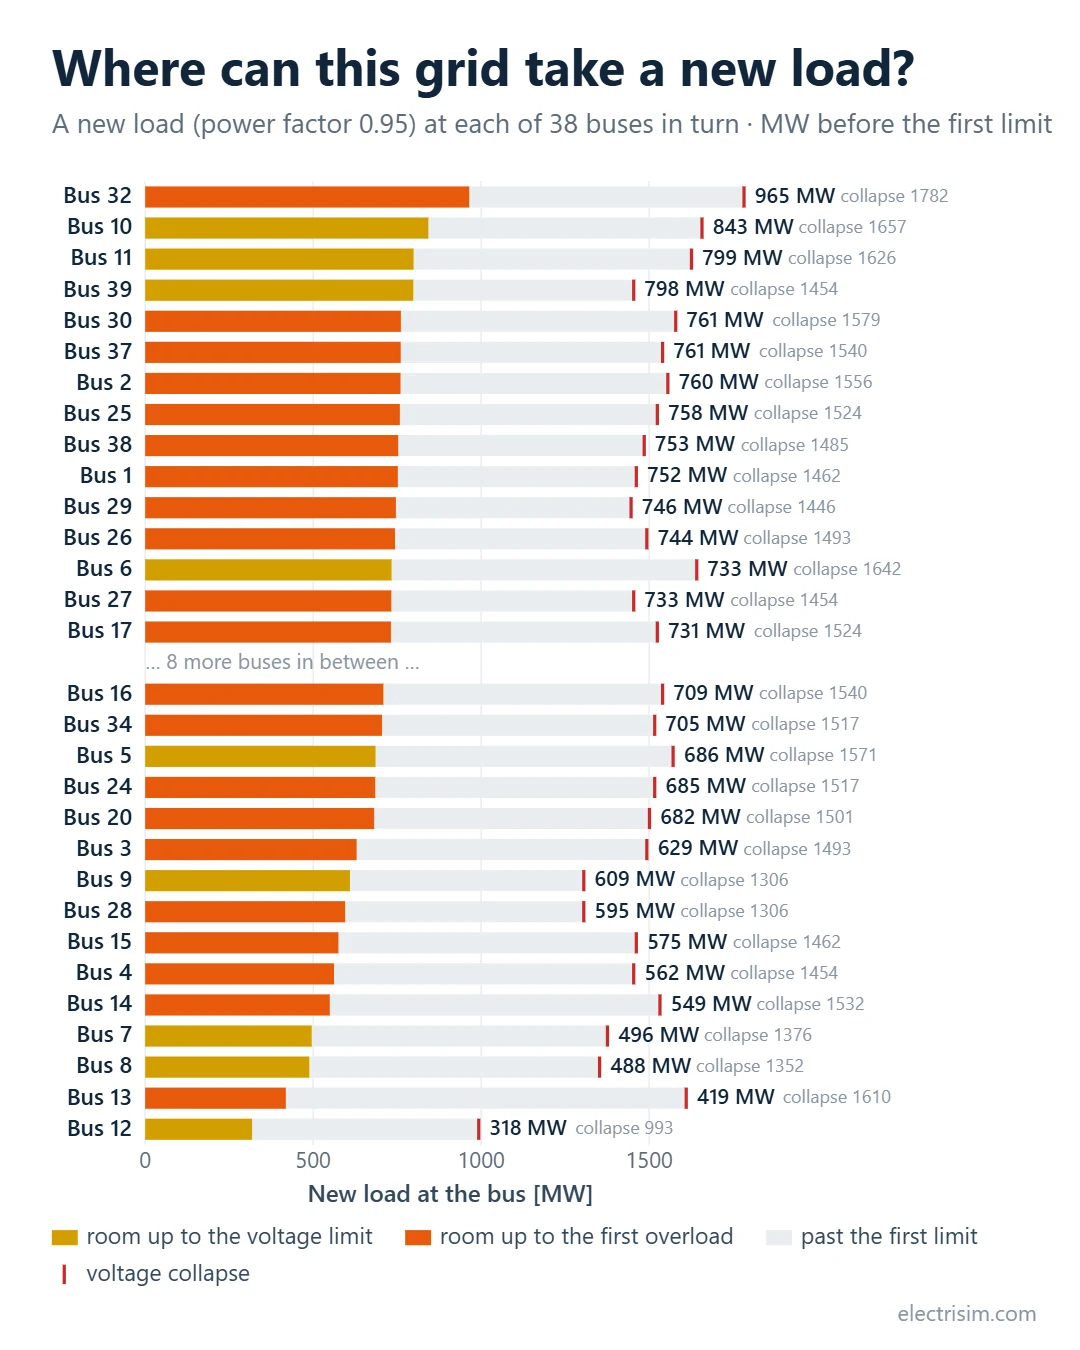
- Bars — one per bus, most room first. The coloured part ends at the first limit that is met (voltage limit or first overload); the pale part runs on to the collapse point.
- Table — the same values with the element that sets each limit. P-V curve on a row runs the full one-bus study for that bus with the same settings.
- Save image and Download CSV — for a report or a post.
The comparison uses coarser steps than the one-bus study (the collapse point within 1 % instead of 0.2 %), so the two can differ slightly. Each bus is studied on its own: the results do not say what happens when loads are added at two buses at once.
The extra power comes from the slack (External Grid or slack generator); other generators keep their set points, and their reactive limits apply only where they are entered. The network is intact (no outage), and this is steady-state voltage stability, not a dynamic simulation. With generator redispatch, reactive limits everywhere or an outage, the margins are lower.
How it works (backend)
How it works (backend)
- Starting point: AC load flow on the network as drawn. The study stops here with a message if it does not converge.
- Bracketing: the load is raised with a step that doubles each time, until a load flow fails.
- Bisection: the interval between the last solved and the first failed value is halved until it is within 0.2 %. Each solve starts from the previous solution, which keeps it on the upper (stable) branch of the curve.
- Curve: 45 points are solved between the starting point and the tip, closer together near the tip.
- Limits: the load at which a bus first drops below the minimum voltage and at which a line or transformer first exceeds the maximum loading is found by interpolating between points.
The tip is the last point that solved, so it is slightly below the true one. On a two-bus network (a stiff source, a lossless reactance X and a load) the result matches the textbook maximum power transfer: 151.2 MW against V²/2X = 151.25 MW at unity power factor, and 109.5 MW against 109.50 MW at power factor 0.95.
Messages you may see
- The load flow of the network as drawn did not converge — run Load Flow and resolve what it reports first.
- The bus is the slack bus — the External Grid bus holds its voltage and supplies whatever is asked, so it has no collapse point. Choose another bus.
- There are no in-service loads to grow — add a Load, or use the one-bus mode.
Last updated: November 2026