Grid code compliance study: P‑Q and U‑Q capability at the point of connection
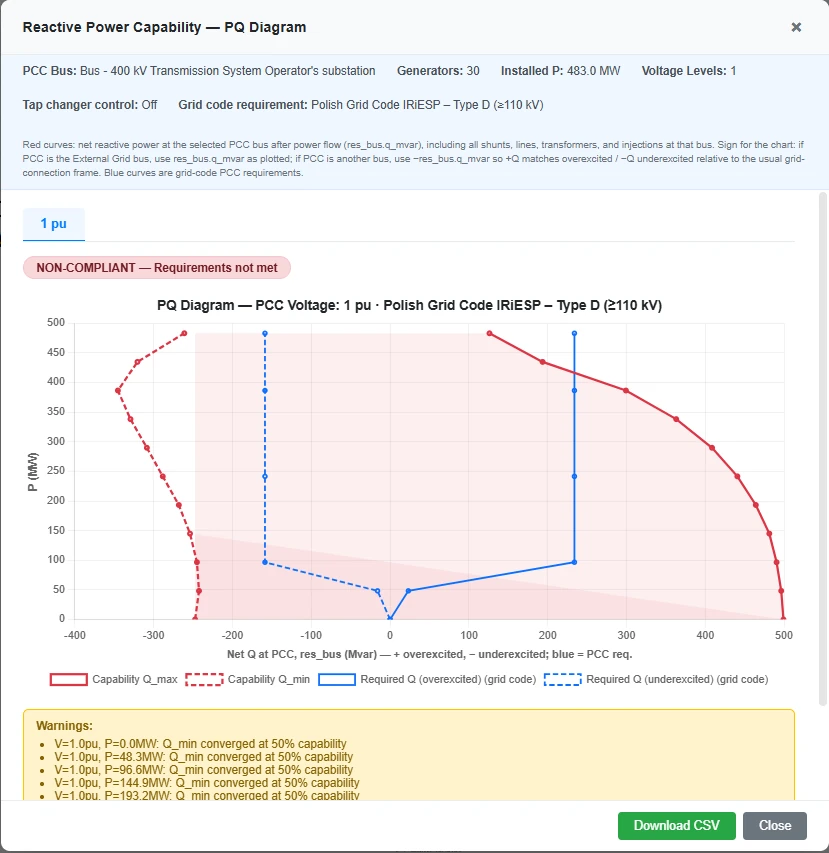
An example result. Red is what the plant can deliver at the point of connection and blue is what the grid code asks for. Here red does not cover blue everywhere, so the plant is reported as non-compliant.
Before a wind farm, a solar plant or a battery is allowed to connect, the grid operator wants to know how much reactive power it can deliver and absorb. The requirement is written in the grid code as an area on a diagram. The plant complies when the area it can actually cover contains the area the code asks for.
The check sounds simple and is tedious by hand, because the reactive power that counts is not the one at the inverter terminals. It is what is left at the point of connection after the cables, the transformers and the shunt reactors have taken their share. That takes a load flow for every operating point. This guide explains the two diagrams and how the study is run in Electrisim.
Two diagrams, two questions
| P-Q diagram | U-Q/Pmax diagram | |
|---|---|---|
| Question | How much Q is available at each active power? | How much Q is available at full power when the grid voltage changes? |
| What is swept | Plant active power, at one or more grid voltages | Grid voltage, with the plant held at Pmax |
| What usually limits it | Converter current at high P, cable charging at low P | Converter voltage limits at high grid voltage, current at low grid voltage |
Most codes that follow the European network code on requirements for generators (NC RfG) ask for both. A typical figure for a power park module is a reactive power range of 0.33 Q/Pmax in each direction at full output, which is a power factor of 0.95.
Why the answer is at the point of connection
Take a plant with 100 MW of inverters. At full output the collector cables and the transformers lose a few MW, so the point of connection never sees 100 MW. The transformers also absorb reactive power, roughly their short-circuit voltage times the square of their loading, and long export cables generate it. A plant whose inverters cover the requirement exactly at their terminals therefore misses it at the point of connection on the inductive or on the capacitive side.
Electrisim draws both curves at the same place for this reason:
- Red: capability. Net P and Q at the point of connection from each solved load flow, with all losses included.
- Blue: requirement. The grid code envelope, scaled to the highest net P that reaches the point of connection.
The plant is compliant when red covers blue at every active power on the envelope.
How the P-Q study works
For each grid voltage and each active power step, Electrisim sets the units to the largest reactive power their capability curve allows and runs a load flow. If the load flow does not solve, or a line, a transformer or a terminal voltage is outside its limit, the reactive power is reduced step by step until the operating point is valid. The result is the largest Q the plant can deliver without breaking a limit, which is the number a grid operator will ask about. The same is done on the absorbing side.
Reactive power can be dispatched in two ways:
- Local Q. Every turbine or inverter gets its own setpoint, the same share of its own limit.
- Park Controller. One setpoint is requested at the point of connection, and the controller moves the units until the load flow meets it. This is how most plants are operated.
Tap changers, shunt reactors and a STATCOM can take part. With tap control switched on, every point is solved at both edges of the tap changer’s voltage band and the more restrictive result is kept.
How to run it
- Model the plant: the bus at the point of connection, an External Grid on it, the wind turbines or static generators, and a Park Controller if the plant has one.
- Run a normal load flow to make sure the model solves.
- Click Simulate → Grid Code Compliance (P-Q).
- Select the point of connection, the external grid and the units. Set the active power sweep and the grid voltages, for example 0.95, 1.0 and 1.05 p.u.
- Pick a grid code template, or type your own table of P, Qmin and Qmax.
- Run the study. For the second diagram, repeat with Grid Code Compliance (V-Q).
Built-in templates cover the ENTSO-E RfG envelopes for power park modules, VDE-AR-N 4110 and 4120 (Germany), the Polish IRiESP, the GB Grid Code, Spanish P.O. 12.2, the Danish and Italian codes and the Saudi Arabian Grid Code. They are summaries for study work. The binding numbers are the ones in the code text and in your connection agreement.
Reading the result
- Compliance badge. Compliant or not, for the template you chose.
- Click a red point to put that load flow on the single-line diagram and see which element is at its limit.
- Check overloads lists every line and transformer above its rating in any of the analysed cases. It reads the stored load flows, so it costs no extra run time.
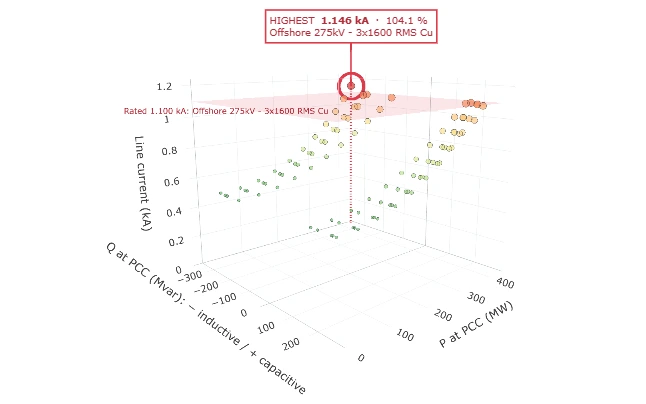
- Line current 3D shows the current in a cable over every load flow of the study, with its rating as a plane.
- Save image gives a report-size picture of the chart, and Download CSV the numbers behind it.
Three things that are easy to get wrong
- Rated voltage and declared voltage. A code may define 1.0 p.u. on a declared voltage Uc that differs from the rated voltage of the bus. With Un = 110 kV and Uc = 115 kV, the 1.0 p.u. case is 1.045 p.u. on the model. Both can be entered in the dialog.
- P = 0 is not “plant off”. On the diagram the units still deliver reactive power at zero active power. What remains with the units switched off, mostly cable charging, is a separate result.
- Sign of Q. The chart uses the generator convention: positive Q is capacitive and supplied to the grid. A shunt reactor shows up as negative.
Limits of the study
This is a steady-state load-flow study on pandapower. It answers the reactive power capability question. It does not cover fault ride-through, frequency response or the dynamic behaviour of the controllers, and it is not a submission to a grid operator on its own.
The onshore and offshore wind farm templates under New diagram are set up for this study. Open one at app.electrisim.com.
Related: grid code compliance in the documentation, the video walkthroughs for an onshore and an offshore wind farm, and how to size reactive power compensation when the plant falls short.